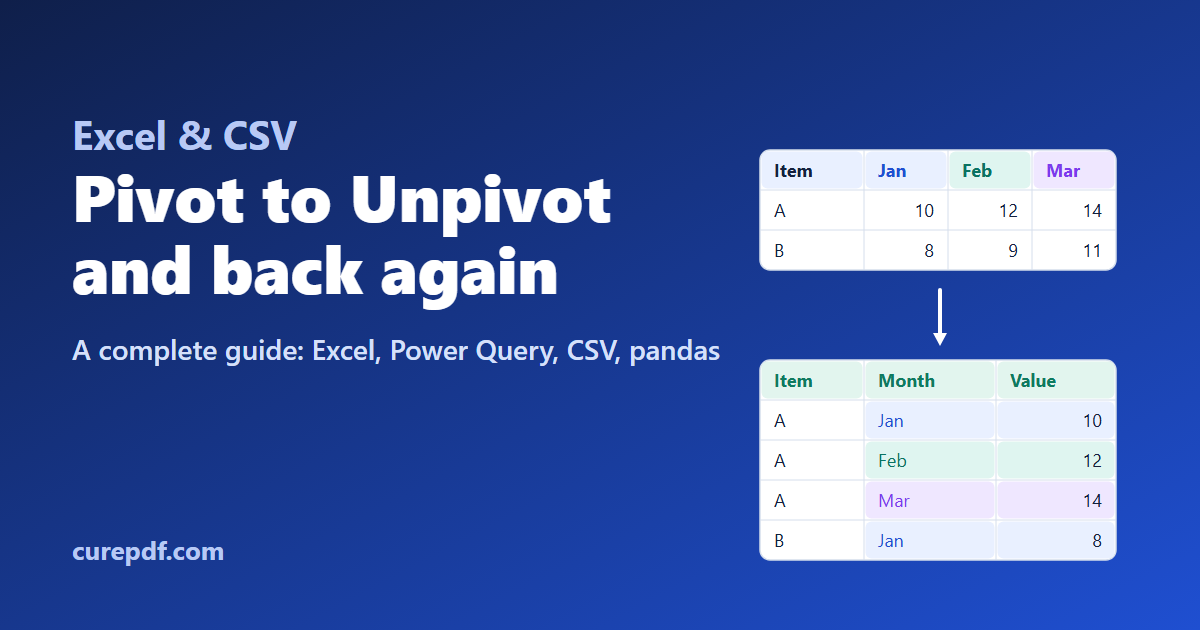
A sales report often arrives with one column per month: Product, Jan, Feb, Mar. It's easy to read, but the moment you try to chart it, filter it by month, load it into a database, or add April, that shape starts working against you. The fix is to unpivot the table — turn the month columns into rows — and, when you need a readable report again, pivot it back.
This guide explains both shapes, when to use each, and how to convert between them in Excel with Power Query, in CSV workflows, and in Python with pandas.
Quick answer: To unpivot in Excel, select your data, choose Data › From Table/Range, select the columns you want to keep, then choose Transform › Unpivot Columns › Unpivot Other Columns. To pivot back, select the column whose values should become headers and choose Transform › Pivot Column.
What Is Pivoted Data?
Pivoted data — also called wide data — spreads one kind of value across several columns. In this table, the months aren't stored in a “Month” column; each month is a column:
| Product | Jan | Feb | Mar |
|---|---|---|---|
| Laptop | 100 | 120 | 140 |
| Monitor | 80 | 95 | 110 |
People read this shape easily: one row per product, the months side by side. That's why most printed reports, budgets, and dashboards look like this.
Pivoted data vs an Excel PivotTable
The words are related but not identical. An Excel PivotTable is an interactive summary tool: it groups and aggregates source data and displays the result in a pivoted layout. Pivoting, as a data transformation, is the general operation of turning the values of one column into new columns. A PivotTable is one way to produce pivoted output — and, notably, it works best when its source data is unpivoted.
What Is Unpivoted Data?
Unpivoted data — also called long or tidy data, and loosely described as “normalized” — gives every type of information its own column. The months move into a Month column, and the numbers into a Sales column:
| Product | Month | Sales |
|---|---|---|
| Laptop | Jan | 100 |
| Laptop | Feb | 120 |
| Laptop | Mar | 140 |
| Monitor | Jan | 80 |
| Monitor | Feb | 95 |
| Monitor | Mar | 110 |
It's longer and harder to scan, but it's much easier for software to work with:
- Adding a period adds rows, not columns. April is three new rows; the structure never changes, so formulas, queries, and reports keep working.
- Filtering and grouping are simple. “Sales in February” is a filter on one column instead of “find the right column.”
- Databases expect it. A database table has a fixed set of columns, so a new column per month doesn't fit.
- BI and charting tools expect it. Power BI, Tableau, and most charting libraries want a date or category field they can drag onto an axis, not twelve separate columns.
Pivot vs Unpivot: What Is the Difference?
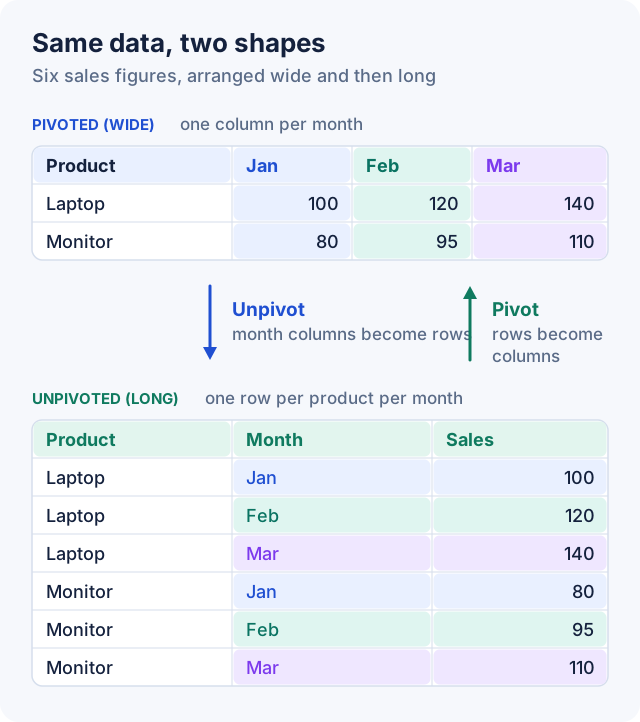
Unpivoting converts several columns that represent categories (Jan, Feb, Mar) into rows, with one new column holding the old column names and another holding the values. Pivoting does the reverse: it takes the distinct values of one column and turns them into new columns.
| Aspect | Pivoted (wide) | Unpivoted (long) |
|---|---|---|
| Structure | One column per category (e.g. per month) | One column per type of information |
| Rows | Fewer — one per item | More — one per item per category |
| Columns | Grow as categories are added | Fixed |
| Best use cases | Reports people read | Data that software processes |
| Reporting | Easy to read and print | Usually pivoted for display |
| Data analysis | Awkward to filter or group by category | Easy to filter, group, and sort |
| Database compatibility | Poor — the schema changes with new categories | Good — a stable schema |
| Visualization | Fine for a fixed table | Preferred by Power BI, Tableau, and charting tools |
| Ease of aggregation | Totals across a row are easy; anything else needs care | Any grouping works the same way |
Neither shape is better in general. The usual workflow is to store and analyze data in the long shape, and present it in the wide shape.
Common mistake: Transposing is not unpivoting. Excel's Paste Special › Transpose swaps every row with every column, so products would become column headers. Unpivoting moves only the category columns into rows and keeps your ID columns in place. If you need to “convert columns to rows” for analysis, you almost always want unpivot.
Why convert pivoted data to unpivoted data?
- To load a report or export into a database, Power BI, or Tableau.
- To chart or filter by a category that's currently spread across columns.
- To combine files where each one has a different set of month columns.
- To use the data as the source of an Excel PivotTable.
Why convert unpivoted data to pivoted data?
- To build a readable summary for a report, email, or presentation.
- To compare categories side by side, such as months or regions.
- To match a template or system that expects one column per period.
How to Convert Pivoted Data to Unpivoted Data in Excel
Power Query is the most reliable way to unpivot in Excel. It's built into Excel 2016 and later for Windows (under Data › Get & Transform Data), and into Excel for Microsoft 365. Every step is recorded, so when your source data changes you can refresh instead of starting over.
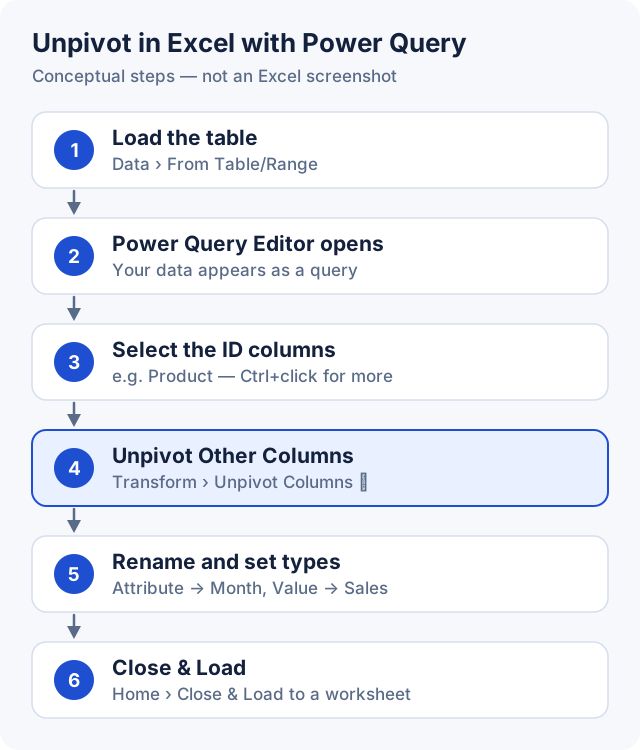
- Select your data. Click any cell inside it. Make sure it has exactly one header row, with no merged cells and no totals row.
- Load it into Power Query. Choose Data › From Table/Range. If the range isn't already an Excel table, Excel offers to create one — check that My table has headers is ticked.
- Review it in the Power Query Editor. Your data opens as a query. Nothing you do here changes the original sheet.
- Select the ID columns. These are the columns that should stay as they are — here,
Product. Ctrl+click to select more than one (for example,RegionandProduct). - Unpivot the rest. Choose Transform › Unpivot Columns (open its drop-down arrow) › Unpivot Other Columns, or right-click a selected header. Power Query replaces the month columns with two new ones:
Attribute(the old column names) andValue(their contents). - Rename and set types. Double-click the headers to rename
AttributetoMonthandValuetoSales. Then click the icon at the left of each header to set a data type, such as Text for Month and Whole Number for Sales. - Load the result. Choose Home › Close & Load. The unpivoted table appears on a new sheet. When the source changes, choose Data › Refresh All to re-run every step.
Tip: Prefer Unpivot Other Columns over unpivoting the month columns by name. Power Query then remembers the columns you kept, so a new
Aprcolumn added to the source later is unpivoted automatically on refresh. Unpivot Only Selected Columns does the opposite and fixes the list.
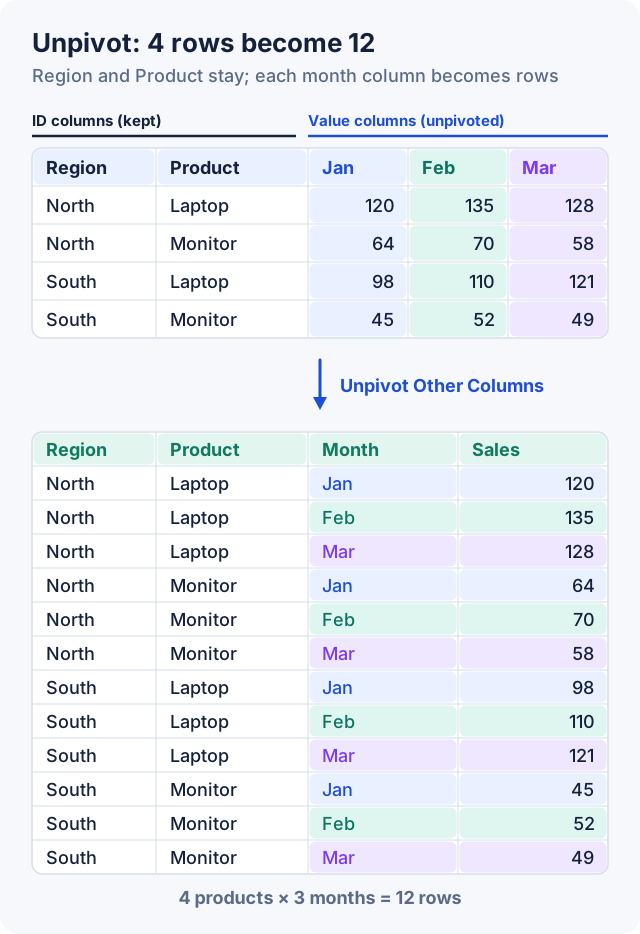
Here is the same operation on a slightly larger table, with two ID columns:
How to Convert Unpivoted Data Back to Pivoted Data in Excel
Pivoting in Power Query takes one column's values and turns them into new column headers.
- Load the long table with Data › From Table/Range.
- Select the column whose values should become headers — here,
Month. - Choose Transform › Pivot Column.
- Set Values Column to the column that fills the cells —
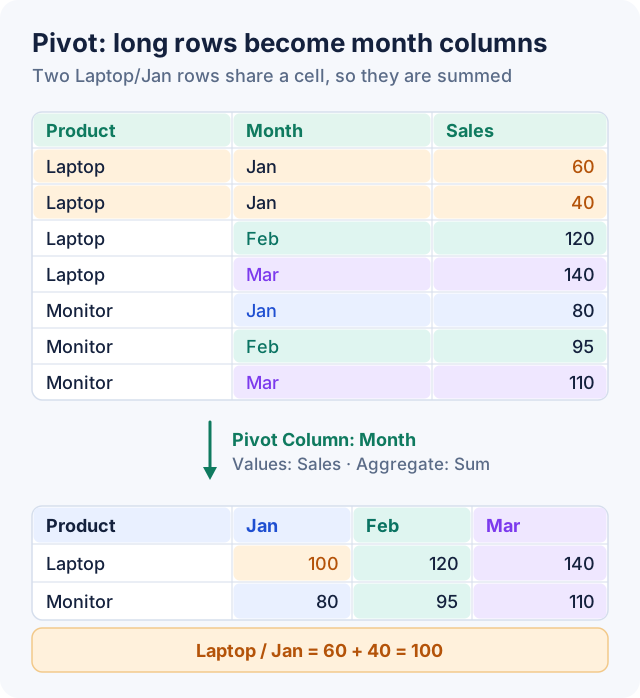
Sales. - Open Advanced options and choose an Aggregate Value Function. This decides what happens when several rows share the same row and column (see below).
- Click OK, then Home › Close & Load.
Choosing the right aggregation
| Aggregation | Use it when | Example |
|---|---|---|
| Sum | Values add up | Sales amounts, quantities, hours |
| Count | You want the number of records | Number of orders per product per month |
| Average | You want a typical value | Unit prices, scores, ratings |
| Minimum / Maximum | You want the lowest or highest | Lowest price, peak temperature |
| Don't Aggregate | Every row/column pair is already unique | One budget figure per department per month |
With Don't Aggregate, a duplicate row/column pair makes the step fail with an error such as “There were too many elements in the enumeration to complete the operation.” That error is a signal to check for duplicates, not a bug.
Common mistake: Averaging values that should be summed, or summing values that should be averaged. Adding up unit prices produces a meaningless number; averaging monthly sales hides the total. Decide what one cell should mean before you pick the aggregation.
Using an Excel PivotTable instead
For a quick summary, an Excel PivotTable also turns long data into a wide layout. Choose Insert › PivotTable, then drag Product to Rows, Month to Columns, and Sales to Values. A PivotTable sums numbers by default, and lets you change that under Value Field Settings.
To convert a PivotTable to a normal table, first flatten its layout. On the PivotTable Design tab, set Report Layout › Show in Tabular Form and Repeat All Item Labels, turn off Subtotals and Grand Totals, then copy the PivotTable and use Paste Special › Values.
Tip: Recent versions of Excel for Microsoft 365 also include a
PIVOTBYfunction that builds a pivoted summary with a single formula. Check that it's available in your version before relying on it in shared workbooks.
How to Unpivot CSV Data
A CSV file is plain text: rows of values separated by commas. It has no PivotTables, formulas, or data types of its own, so “unpivoting a CSV” always means loading it into a tool, reshaping it there, and exporting a new CSV.
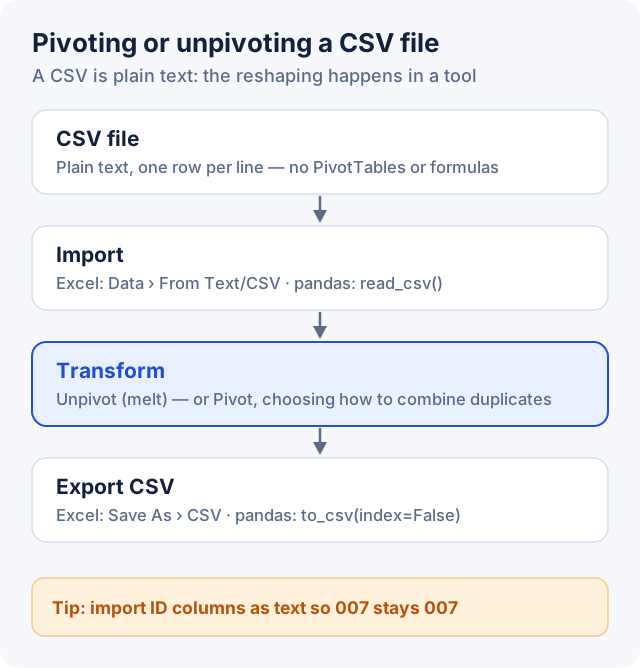
In Excel:
- Choose Data › From Text/CSV, pick the file, then click Transform Data (not Load) to open Power Query.
- Check the Changed Type step Power Query adds automatically. It may turn codes like
007into the number7; set those columns to Text. - Unpivot as described above, then Close & Load.
- Choose File › Save As and pick CSV UTF-8 (Comma delimited). Excel saves only the active sheet to CSV.
Databases can do the same job: SQL Server and Oracle have an UNPIVOT operator, and other databases can combine one SELECT per column with UNION ALL.
How to Pivot CSV Data
Pivoting a CSV follows the same path — load, group or pivot, export — but you also need to decide how to combine rows that share a row and column. Given this input:
Product,Month,Sales
Laptop,Jan,60
Laptop,Jan,40
Laptop,Feb,120
Laptop,Mar,140
Monitor,Jan,80
Monitor,Feb,95
Monitor,Mar,110
a pivot on Month with Sales as the values and Sum as the aggregation produces:
Product,Jan,Feb,Mar
Laptop,100,120,140
Monitor,80,95,110
In Excel, use Data › From Text/CSV › Transform Data, then Transform › Pivot Column, and save as CSV. In pandas, use pivot_table(), shown next.
Pivot and Unpivot Using Python pandas
In pandas, melt() unpivots and pivot() pivots. The examples below use pandas 2.x.
Unpivot with melt()
import pandas as pd

wide = pd.DataFrame({
    "Product": ["Laptop", "Monitor"],
    "Jan": [100, 80],
    "Feb": [120, 95],
    "Mar": [140, 110],
})

long = wide.melt(id_vars="Product", var_name="Month", value_name="Sales")
id_vars lists the columns to keep; every other column is unpivoted. Without var_name and value_name, pandas names the new columns variable and value. The result is grouped by month (Laptop Jan, Monitor Jan, Laptop Feb…). To list each product's months in calendar order:
month_order = ["Jan", "Feb", "Mar"]
long["Month"] = pd.Categorical(long["Month"], categories=month_order, ordered=True)
long = long.sort_values(["Product", "Month"], ignore_index=True)
Pivot with pivot()
wide_again = long.pivot(index="Product", columns="Month", values="Sales").reset_index()
wide_again.columns.name = None
#    Product  Jan  Feb  Mar
# 0   Laptop  100  120  140
# 1  Monitor   80   95  110
Pivot with aggregation using pivot_table()
pivot() refuses duplicate row/column pairs with “ValueError: Index contains duplicate entries, cannot reshape.” When duplicates are expected, use pivot_table() and say how to combine them:
sales = pd.DataFrame({
    "Product": ["Laptop", "Laptop", "Monitor", "Laptop"],
    "Month": ["Jan", "Jan", "Jan", "Feb"],
    "Sales": [60, 40, 80, 120],
})

summary = sales.pivot_table(index="Product", columns="Month", values="Sales", aggfunc="sum")
summary = summary[["Jan", "Feb"]].reset_index()  # pivot_table sorts columns alphabetically
summary.columns.name = None
Common mistake:
pivot_table()averages by default. Withoutaggfunc="sum", the Laptop/Jan cell above would be 50, not 100.
Reading and writing CSV files
wide = pd.read_csv("sales_wide.csv", dtype={"StoreID": "string"})
long = wide.melt(id_vars=["StoreID", "Product"], var_name="Month", value_name="Sales")
long.to_csv("sales_long.csv", index=False)
The dtype argument keeps codes like 007 as text; without it, pandas reads them as the number 7. index=False stops pandas writing its row numbers as an extra column.
Common Problems When Pivoting or Unpivoting
Before you start
- Extra header rows. Titles or notes above the real headers become data. Delete them, or remove them in Power Query with Home › Remove Rows › Remove Top Rows.
- Merged cells. A merged header or label leaves blanks in every cell after the first. Unmerge the cells first, then fill the labels down (Power Query: Transform › Fill › Down).
- Blank rows. Empty rows turn into rows of nulls. Filter them out (Power Query: Home › Remove Rows › Remove Blank Rows).
- Inconsistent column names. “Jan”, “Jan ” (with a trailing space), and “January” become three different months. Clean the headers first, or fix the new Month column afterwards with Trim and Replace Values.
The values themselves
- Missing values. Tools treat blanks differently: Power Query's unpivot leaves out cells that are null, while pandas
melt()keeps them as empty values. Decide whether “no value” should be a row, a zero, or nothing. - Mixed data types. A value column holding both numbers and text (such as “n/a”) can't be summed. Replace or remove the text, or keep the column as text and pick Count, First, or Last.
- Numbers stored as text. Values like
"1,200"or" 95 "look like numbers but aggregate as text. Convert them first (Excel: Data › Text to Columns, or a type change in Power Query; pandas:pd.to_numeric()). - Date formatting. Dates can turn into serial numbers (1 Jan 2026 is 46023 in Excel) or be read in the wrong day/month order. Set the date type explicitly, and use an unambiguous format such as
2026-01-31in exports.
Pivot-specific issues
- Duplicate combinations. Two rows with the same row label and column header must be combined into one cell. Choose an aggregation deliberately rather than letting a tool pick one for you.
- Duplicate records. If the same transaction appears twice by mistake, a Sum double-counts it. Remove true duplicates before pivoting (Excel: Data › Remove Duplicates; Power Query: Home › Remove Rows › Remove Duplicates).
- Incorrect aggregation. Check a few cells by hand after pivoting, especially where rows were combined, and compare the grand total with the source.
When Should You Use Pivoted vs Unpivoted Data?
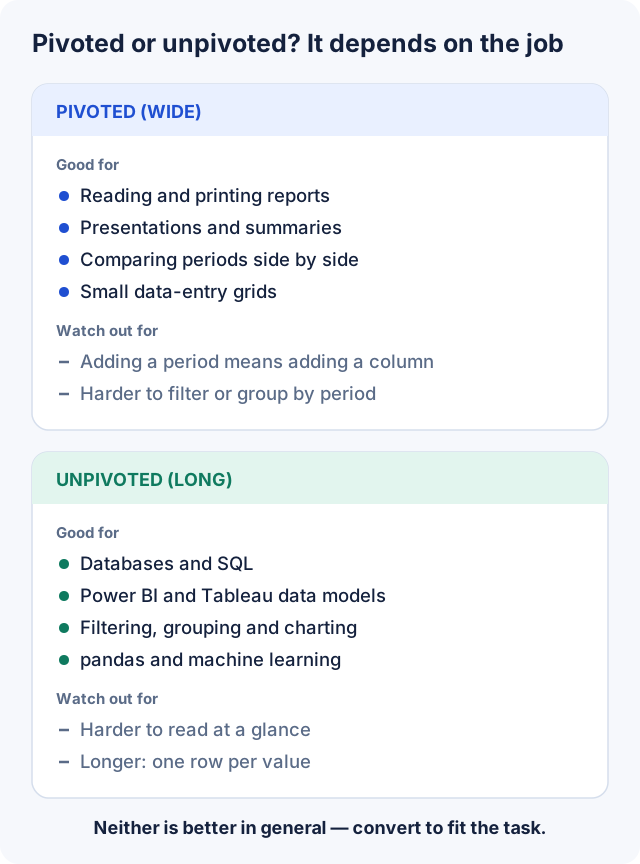
Pivoted data is useful for:
- Human-readable and printed reports
- Summary tables in presentations and emails
- Management dashboards that compare periods side by side
- Small grids where people type in values
Unpivoted data is useful for:
- Data analysis: filtering, grouping, and charting
- Databases and SQL
- BI pipelines and data models in Power BI and Tableau
- pandas, machine learning, and other data processing
A note on terminology: Tableau calls this operation Pivot. On Tableau Desktop's Data Source page, you can select several columns and choose Pivot, which produces Pivot Field Names and Pivot Field Values columns. That's the same reshaping Excel calls unpivot.
Using CurePDF.com for Spreadsheet and CSV Workflows
If you'd rather not open Power Query or write code for a one-off conversion, CurePDF's free Excel Pivot / Unpivot tool does both directions in your browser:
- Input: a
.csv,.xlsx, or.xlsfile. For a workbook with several sheets, you choose the sheet. - Unpivot: tick the ID columns to keep; every other column becomes rows, with Variable and Value columns you can rename.
- Pivot: choose one column for the row labels, one whose values become column headers, and one for the cell values — plus how to combine rows that share a cell: add them up, count them, average, smallest, largest, or keep the first or last.
- Output: preview the result, then download it as CSV or as an Excel
.xlsxfile. - Privacy: the reshaping runs in your browser, so the spreadsheet isn't uploaded to CurePDF's servers.
It also keeps codes such as 007 as written, and shows dates from Excel files as YYYY-MM-DD text rather than serial numbers. A Try it with sample data button lets you see both directions before using your own file.
Other CurePDF tools that fit into the same workflow:
- CSV to Excel Converter — turn a CSV into a real
.xlsxfile, or an Excel sheet into CSV. - Excel Toolkit — remove duplicates, clean data, split or merge columns, sort, and filter before you pivot.
- CSV Viewer — check a CSV as a sortable, searchable table before and after a transformation.
- Excel to JSON Converter — hand spreadsheet data to an app or API.
- PDF to Excel — pull tables out of a PDF report first; see how to convert a PDF to Excel.
Need to work with spreadsheet or CSV files? Explore the tools on CurePDF.com to find the right workflow for your file.
Frequently Asked Questions
What is the difference between pivot and unpivot?
Unpivot turns several category columns (such as Jan, Feb, Mar) into rows, with one column for the category and one for the value. Pivot does the reverse, turning the distinct values of one column into separate columns.
How do I unpivot an Excel table?
Select a cell in the table, choose Data › From Table/Range, select the columns you want to keep in the Power Query Editor, then choose Transform › Unpivot Columns › Unpivot Other Columns. Rename the Attribute and Value columns and choose Home › Close & Load.
Can I unpivot a CSV file?
Yes, but not inside the CSV itself, because CSV is plain text. Load it into Excel (Data › From Text/CSV), pandas, a database, or an online tool, unpivot it there, and export a new CSV.
How do I convert an unpivoted table to a pivot table?
In Power Query, select the column whose values should become headers, choose Transform › Pivot Column, pick the values column, and choose an aggregation. For an interactive summary instead, use Insert › PivotTable with that column in Columns.
Is Power Query required to unpivot Excel data?
No, but it's the most reliable option for repeatable work. For a one-off, you can rearrange the data manually, use formulas in newer versions of Excel, use pandas, or use an online tool such as CurePDF's Excel Pivot / Unpivot tool.
What is the pandas equivalent of Excel Unpivot?
DataFrame.melt(). Pass the columns to keep as id_vars, and name the new columns with var_name and value_name. The reverse is pivot(), or pivot_table() when rows need to be combined.
Why does Power Query create Attribute and Value columns?
Unpivoting needs somewhere to put the old column headers and the numbers that were under them. Power Query names those columns Attribute and Value by default; rename them to something meaningful, such as Month and Sales.
Should data be pivoted or unpivoted for Tableau?
Usually unpivoted. Tableau works best with one field per type of information, such as a single Month field. Tableau can do this reshaping itself with its Pivot option on the Data Source page.
Can duplicate values cause problems during pivoting?
Yes. When two rows share the same row label and column header, the pivot has to combine them into one cell. Choose Sum, Count, Average, Minimum, or Maximum deliberately. In Power Query, “Don't Aggregate” fails on duplicates, and pandas pivot() raises an error.
Can CurePDF convert or process Excel and CSV files?
Yes. CurePDF's free browser-based tools can pivot and unpivot CSV and Excel files, convert CSV to Excel and back, clean and reshape spreadsheets with the Excel Toolkit, view CSV files as tables, and extract tables from PDFs into Excel.